Overview
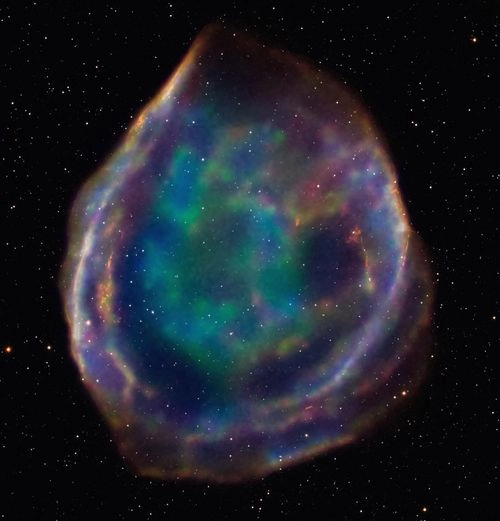
DEM L71 is a Type-1a Supernova(SN) which is a rich Iron(Fe). Proof of Hydrogen were also found as emission were observed. Type-1a SNs are very essential in Astronomy as they act as the standard candles. Being rich in Iron and a Type-1a SN, its most likely that this SNR is due to death of a White-Dwarf star.
For this study, I’m using optical data from WFC3 instrument onboard HST (Proposal ID: 1328, PI: You-Hua Chu) and X-ray Data from ACIS instrument of Chandra X-ray Observatory(CXO) (Obs ID: 775, 3867, 4440).
My main goal of the study is to create elemental distribution and analyze the spectrum of the target to verify previous results. Also, I’m learning about astrophysical radiative processes, so I’ll be testing new models for understanding the plasma phenomena at SNRs.
Basic Data Reduction
The data from the ACIS instrument has been reduced using CIAO as per the standard procedure. For the HST data, I used Four filters: F450W, F555W, F656N and F814W. I used the pipeline reduced data for F656N filter but used multiple raw observation for other filter and combined them to create a master observation, following STScI drizzlepac tutorial.
X-ray Data analysis
First, the data is splited to various channel based on the energy distribution (Hard: 1.2-6 keV, Medium: 0.7-1.2 keV, and Soft: 0.1-0.7 keV) and the plotted them to check for relative contribution. [NOTE : that, I’ve combined observation from all the above mentioned observations.]
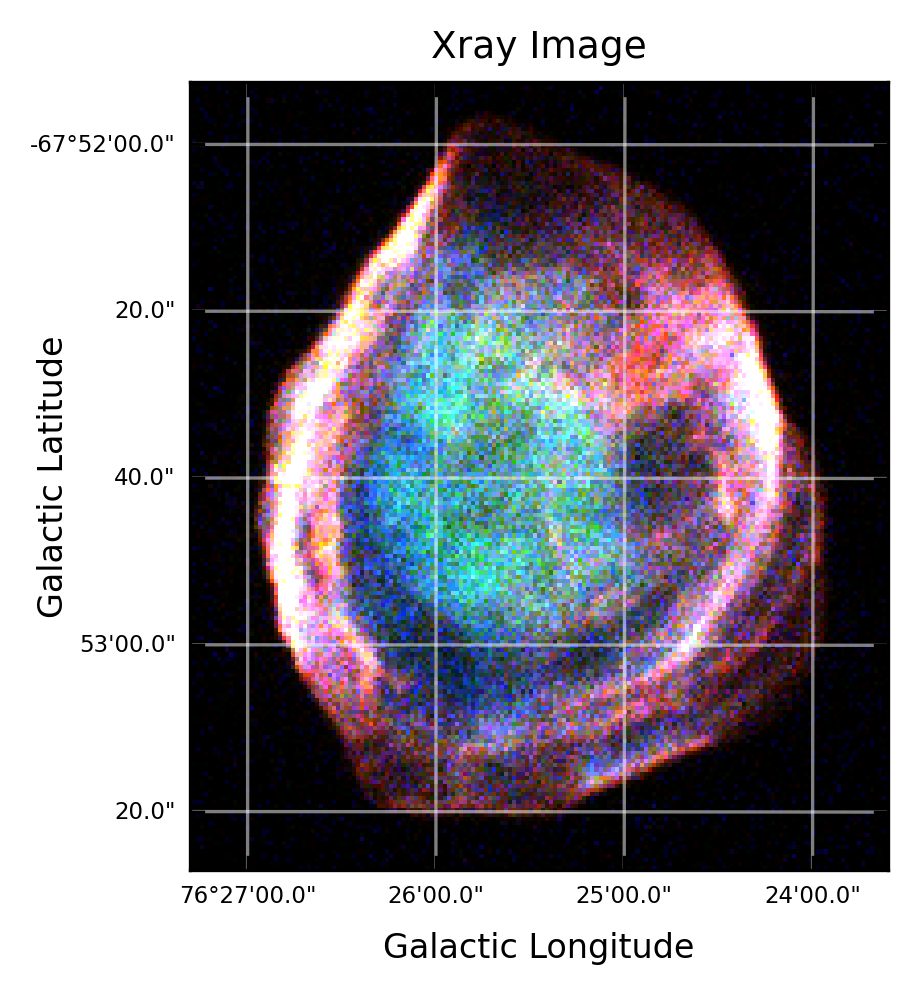
DEML71 in X-ray spectrum.
Then this image is smoothened using a gaussian kernel on each of the three channels (parameters: ). NOTE: this step doesn’t improves the SNR of the data, but rather makes morpohological studies easier.
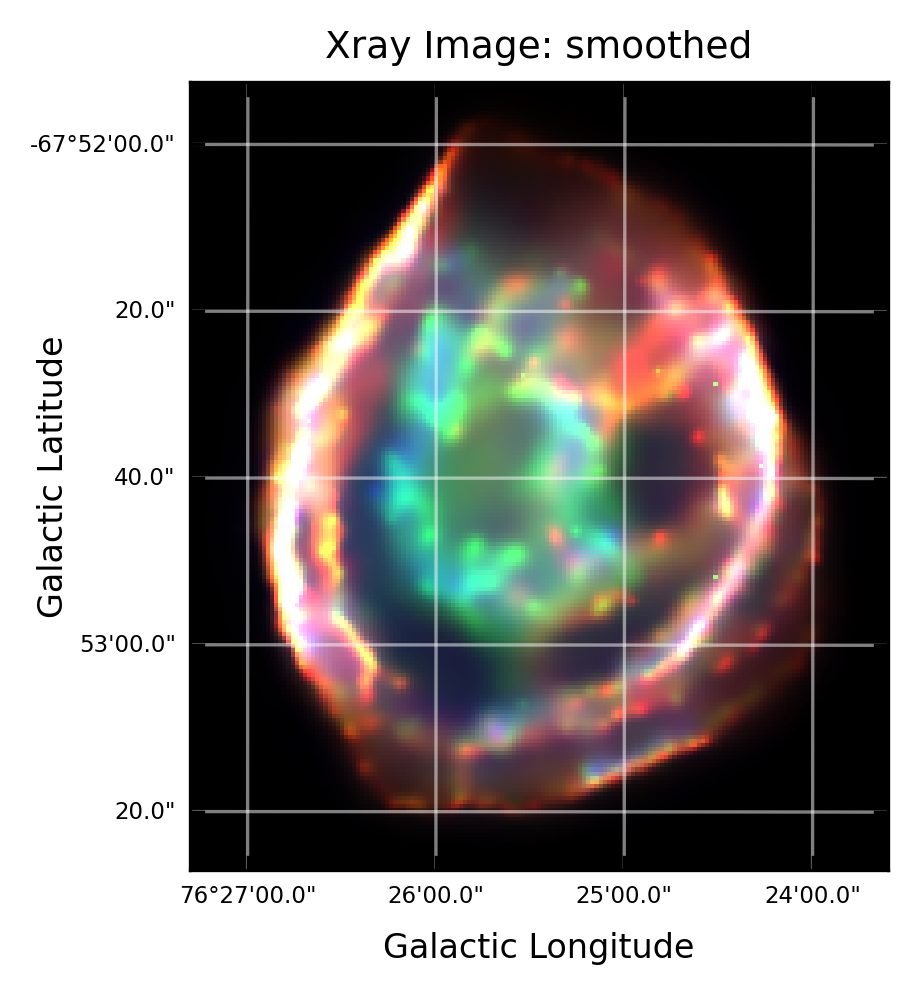
DEML71 in X-ray spectrum with gaussian smoothing.
In both the images, one can clearly observe the double shock morphologies, and infact this is a text-book example of double shocks in SNR. The supersonic Forward shock(FS) is driven by the explosion. On the either side of the forward shock there is interstellar medium(ISM). Behind the FS, the shocked ISM keeps accumulating, along with the ejected materials from the star. The freely expanding ejecta pushes on to the shocked ISM, and a contact discontinuity arises due to density difference between the ISM and the ejecta. As a result, the ejecta never reaches the FS, but instead there is a huge pressure build up behind the FS, which drives the Reverse Shock(RS) by pushing back onto the unshocked ejecta. The RS compresses the unshocked ejected heating the remaining ejecta. The heated freely expanding ejecta is seen in aqua-green color here and one can clearly observe the separation between ejecta and the shockwave.
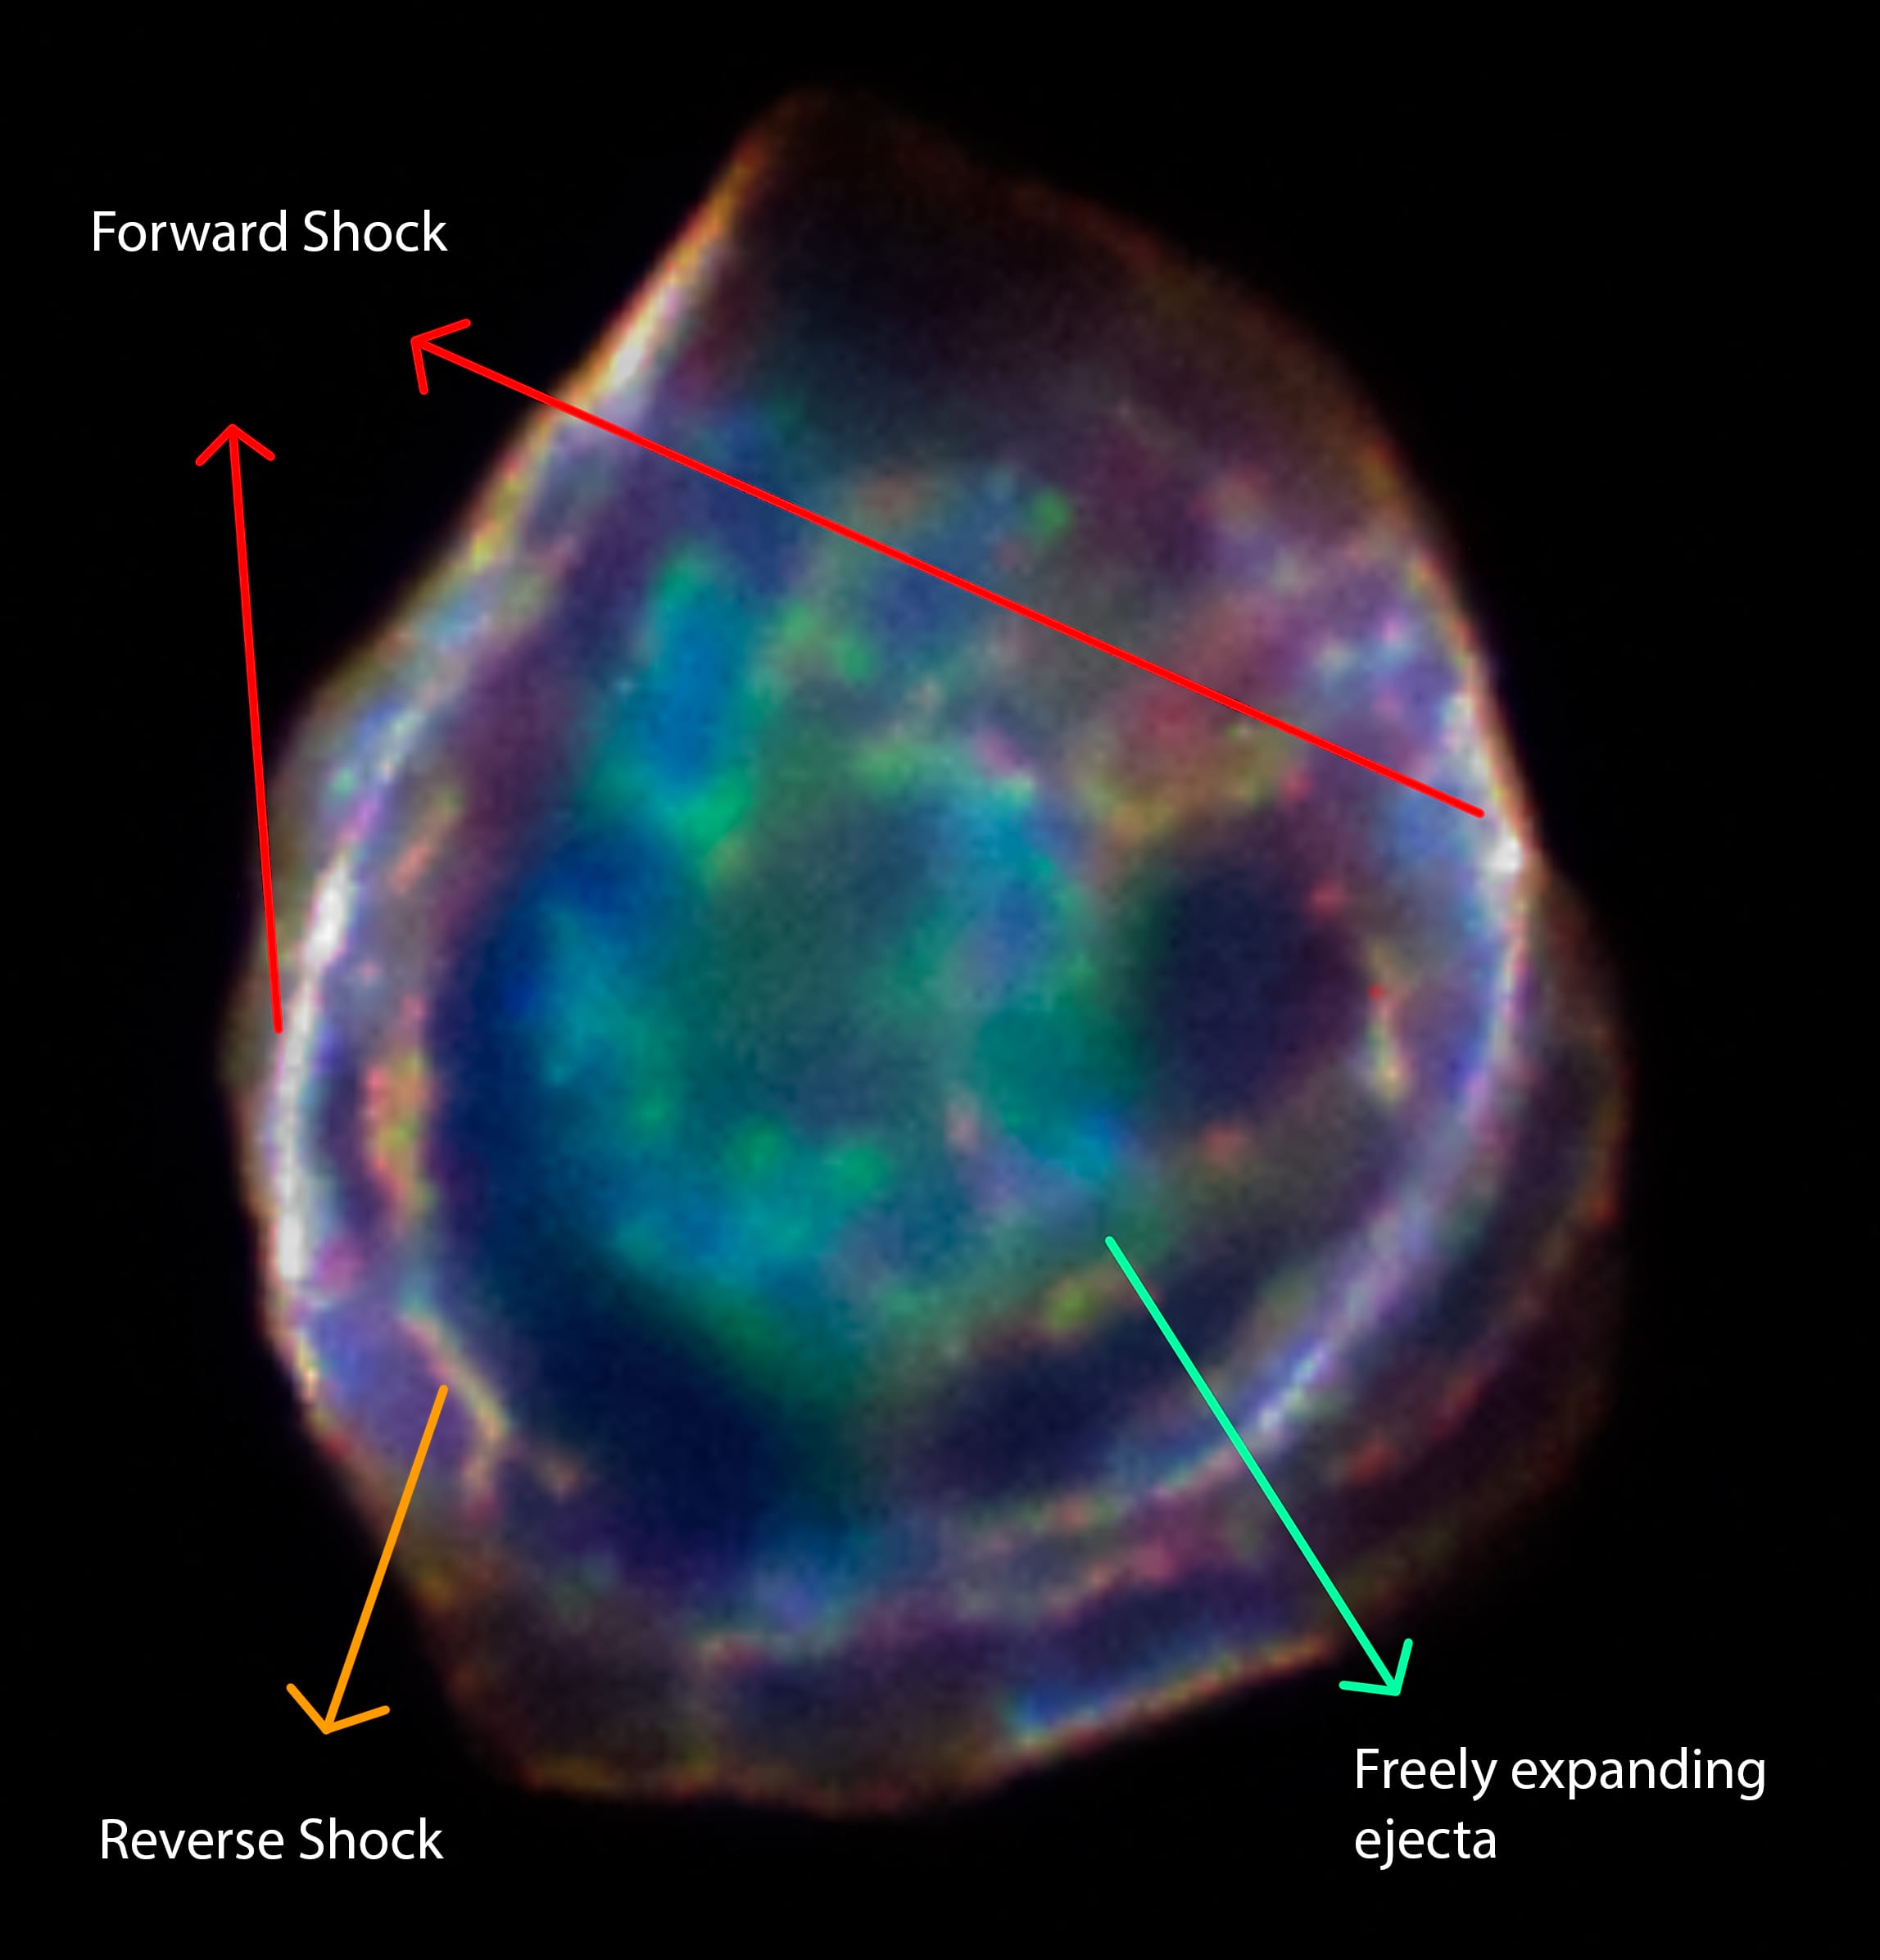
DEML71 in X-ray spectrum, with different components indicated.
Spectral Analysis
For spectral studies, background was subtracted from a small nearby region, and two regions are selected. The region depictions are as follows:
- Central Region : This is the central part of the SNR where the freely expanding ejecta is reheated. Shape-Ellipse
- Outer Rim: Outer part of the SNR where the shock waves are visible. Shape-elliptical anulus The image below shows the regions selected for spectral analysis.
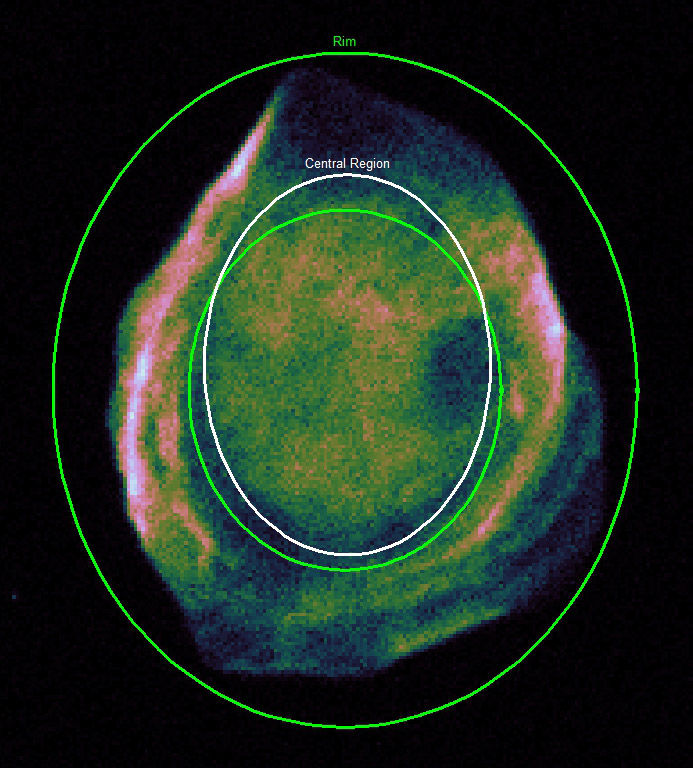
DEML71 in X-ray spectrum, with spectral regions indicated.
Central region
In the enhanced image one can see multiple blobs of emission, which are mainly the reheated ejecta. For this region the absorption model is and for emission, plasma with two thermal components was considered. The emission model is . Thus giving the final model as
Since the counts is low, to fit the data, both Chi-square and CStat are used. Then we select the model with lower value. The fitted data is as follows.

Fitted Xray spectrum of DEML71(central region)
The fitted parameters are as follows:
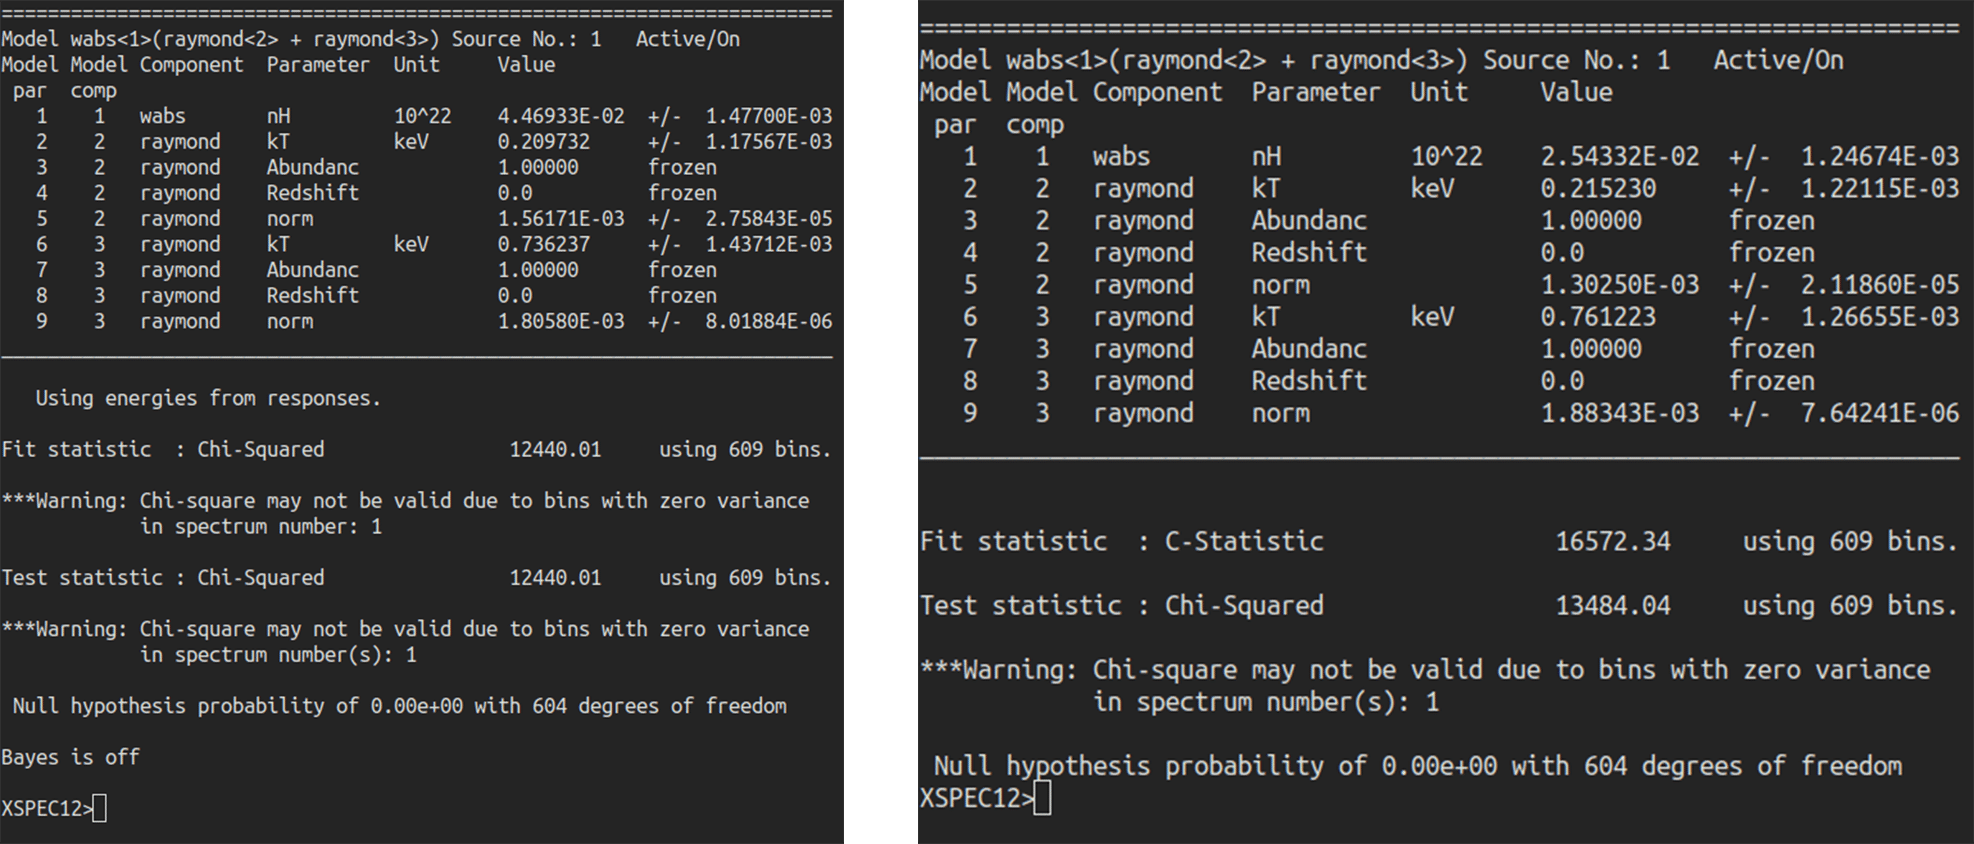
Fitted statistics of Xray spectrum of DEML71(central region)
From the above one can see that, fitting the data with Chi-square statistics gives a better fit. The Reduced Chi-square value are as follows
Thus the model is in good agreement with the data. The values even though differs slightly from what was previously obtained the values obtained are within limit. Just to have an idea of how hot the plasma is, the obtained components translates back to . Its really very very hot!!
The good agreement of the raymond model suggest that the plasma is not so dense and is rather diffused.
The model also misses some hard emission lines beyond 4 keV and is most likely because of higher uncertainty in the data beyond 4 keV.
The data was also fitted with non-equilibrium, collisional plasma models and in that case, the fit was satisfactory, although this doesn’t suggest that the plasma is in equilibrium
Outer Rim
This is the outer region of the SNR, containing the Forward and Reverse shocks. Again for this region the absorption model is and for emission, plasma with two thermal components was considered.The emission model is . Thus giving the final model as
From the previous section it was found that Chi-square statistics gives the fit, so this time only Chi-square fit is used.
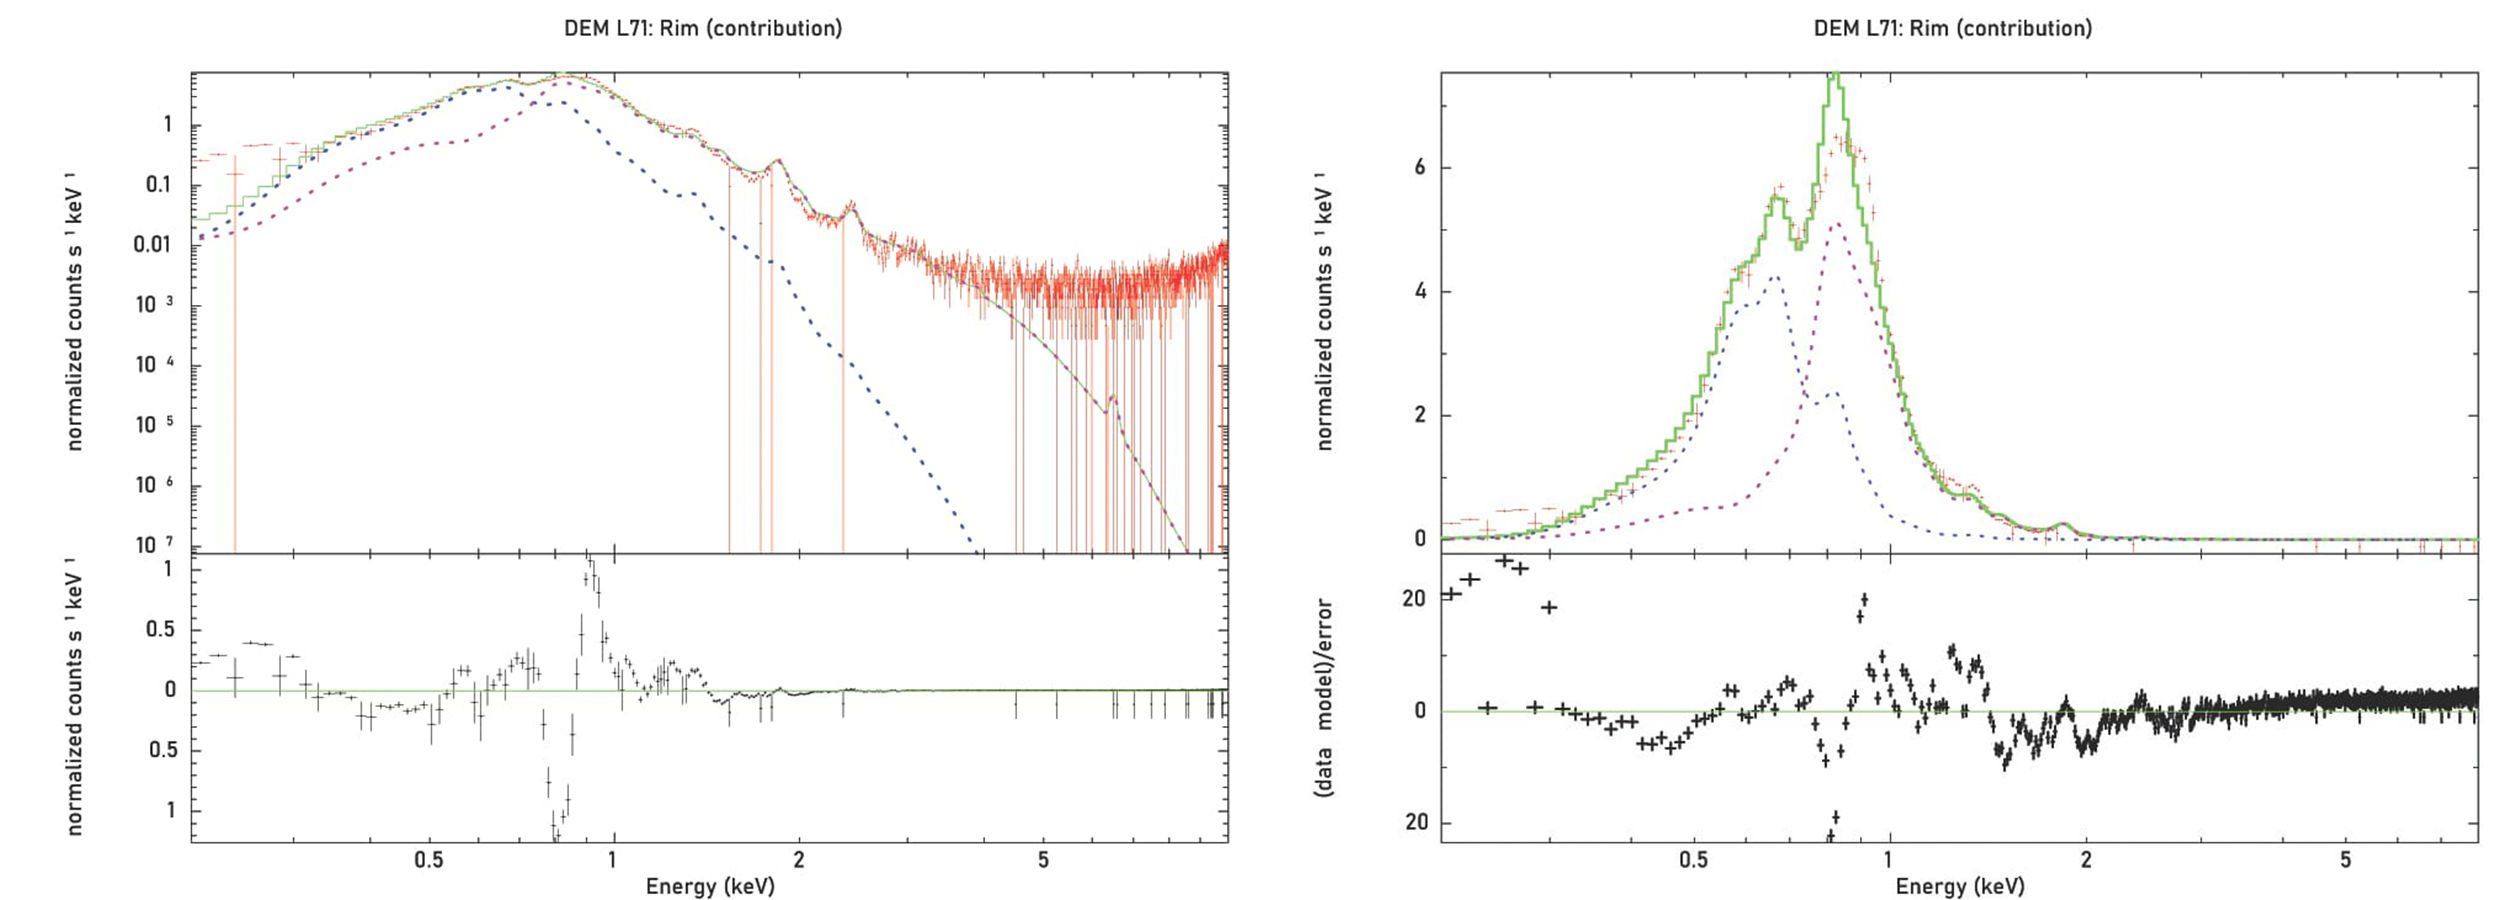
Fitted Xray spectrum of DEML71(Rim region)
The fitted parameters are as follows:
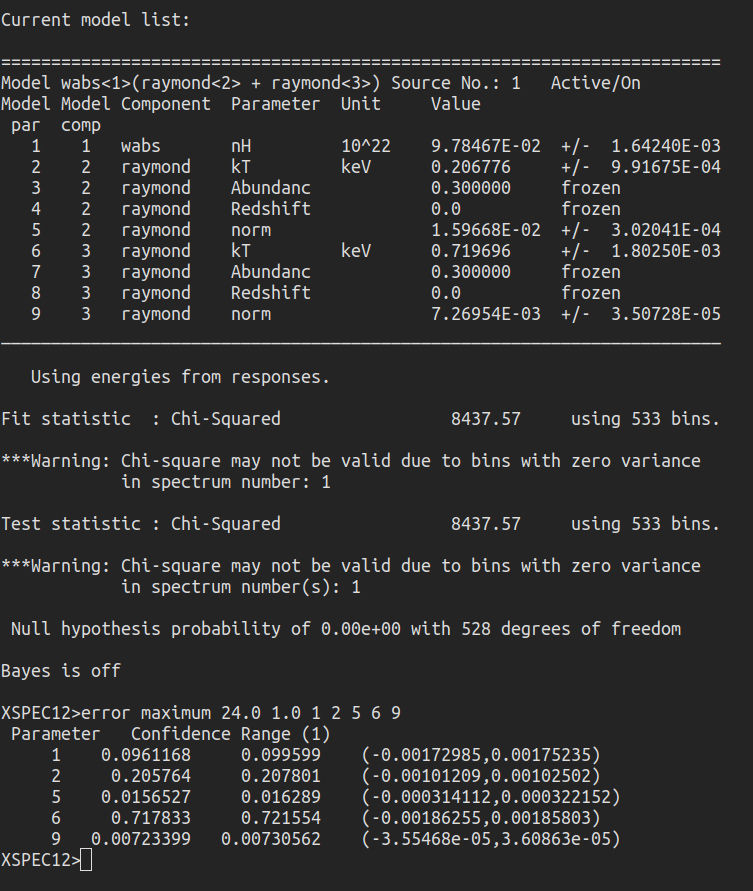
Fitted statistics of Xray spectrum of DEML71(Rim region)
From the above, the The reduced chi-squared value is:
and the parameters estimated are well withing deviation. As you can see above, the model again misses some hard emission lines beyond 4 keV, and underfits below 0.5 KeV, but overall, its a good fit.