Overview
Cas A is one of my favorite astrophysical target, and its one of the most widely studied source. It is extensively studied in Radio and Xray bands. It was being studied from early 1600s. For this project, I got data from both Chandra Xray observatory and Hubble space telescope.
For this project, I don’t intend to do a spectral study. I plan to create false color image from the latest data, and create an expansion animation, to study the evolution of the SNR. The Hubble data comes from HST Propsoal 10286, PI: Robert Fesen. X-ray data comes from multiple CXO observation from 2000-2020, for complete list visit here.
Basic Data Reduction
The data from the ACIS instrument has been reduced using CIAO as per the standard procedure, and then merged together. For the HST data, I used three filters: F475W, F775W and F850LP. I used multiple raw observation for the filters and combined them to create a master observation, following STScI drizzlepac tutorial. Then the ACIS data was scaled up to match the HST data scale.
False Color image
For Creating the X-Ray False color image, The merged observation is separated into K and L band Iron, Calcium and Titanium Emissions and K band Sulfur and Silicon emission. Then I assigned the the following colors to different elements:
- Red : Silicon
- Orange : Sulfur
- Yellow : Calcium
- Green : Titanium
- Purple : Iron
- Blue : Entire Data
- Luminosity : Entire Data
Similary I assigned the following colors to the HST data
- Red : F850LP
- Green : F775W
- Blue : F475W
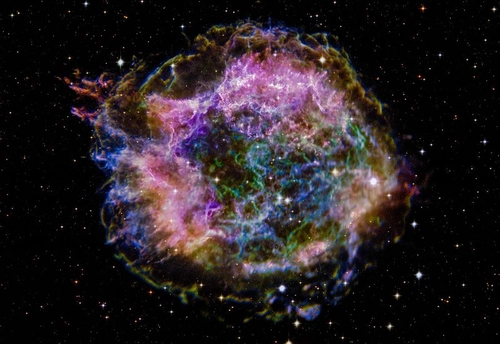
Then, overlaying the X-Ray image over the Optical image, gives the False color composite, which is also the featured image of this article.

Cassiopeia A SNR in X-ray and Optical spectrum.
If you look closely, you can clearly identify the Forward and the Reverse shock waves, along with the freely expanding ejecta. Previous studies suggest that, NEI (non equilibrium) models fits the data well, suggesting that the plasma is not in equilibrium (reference).
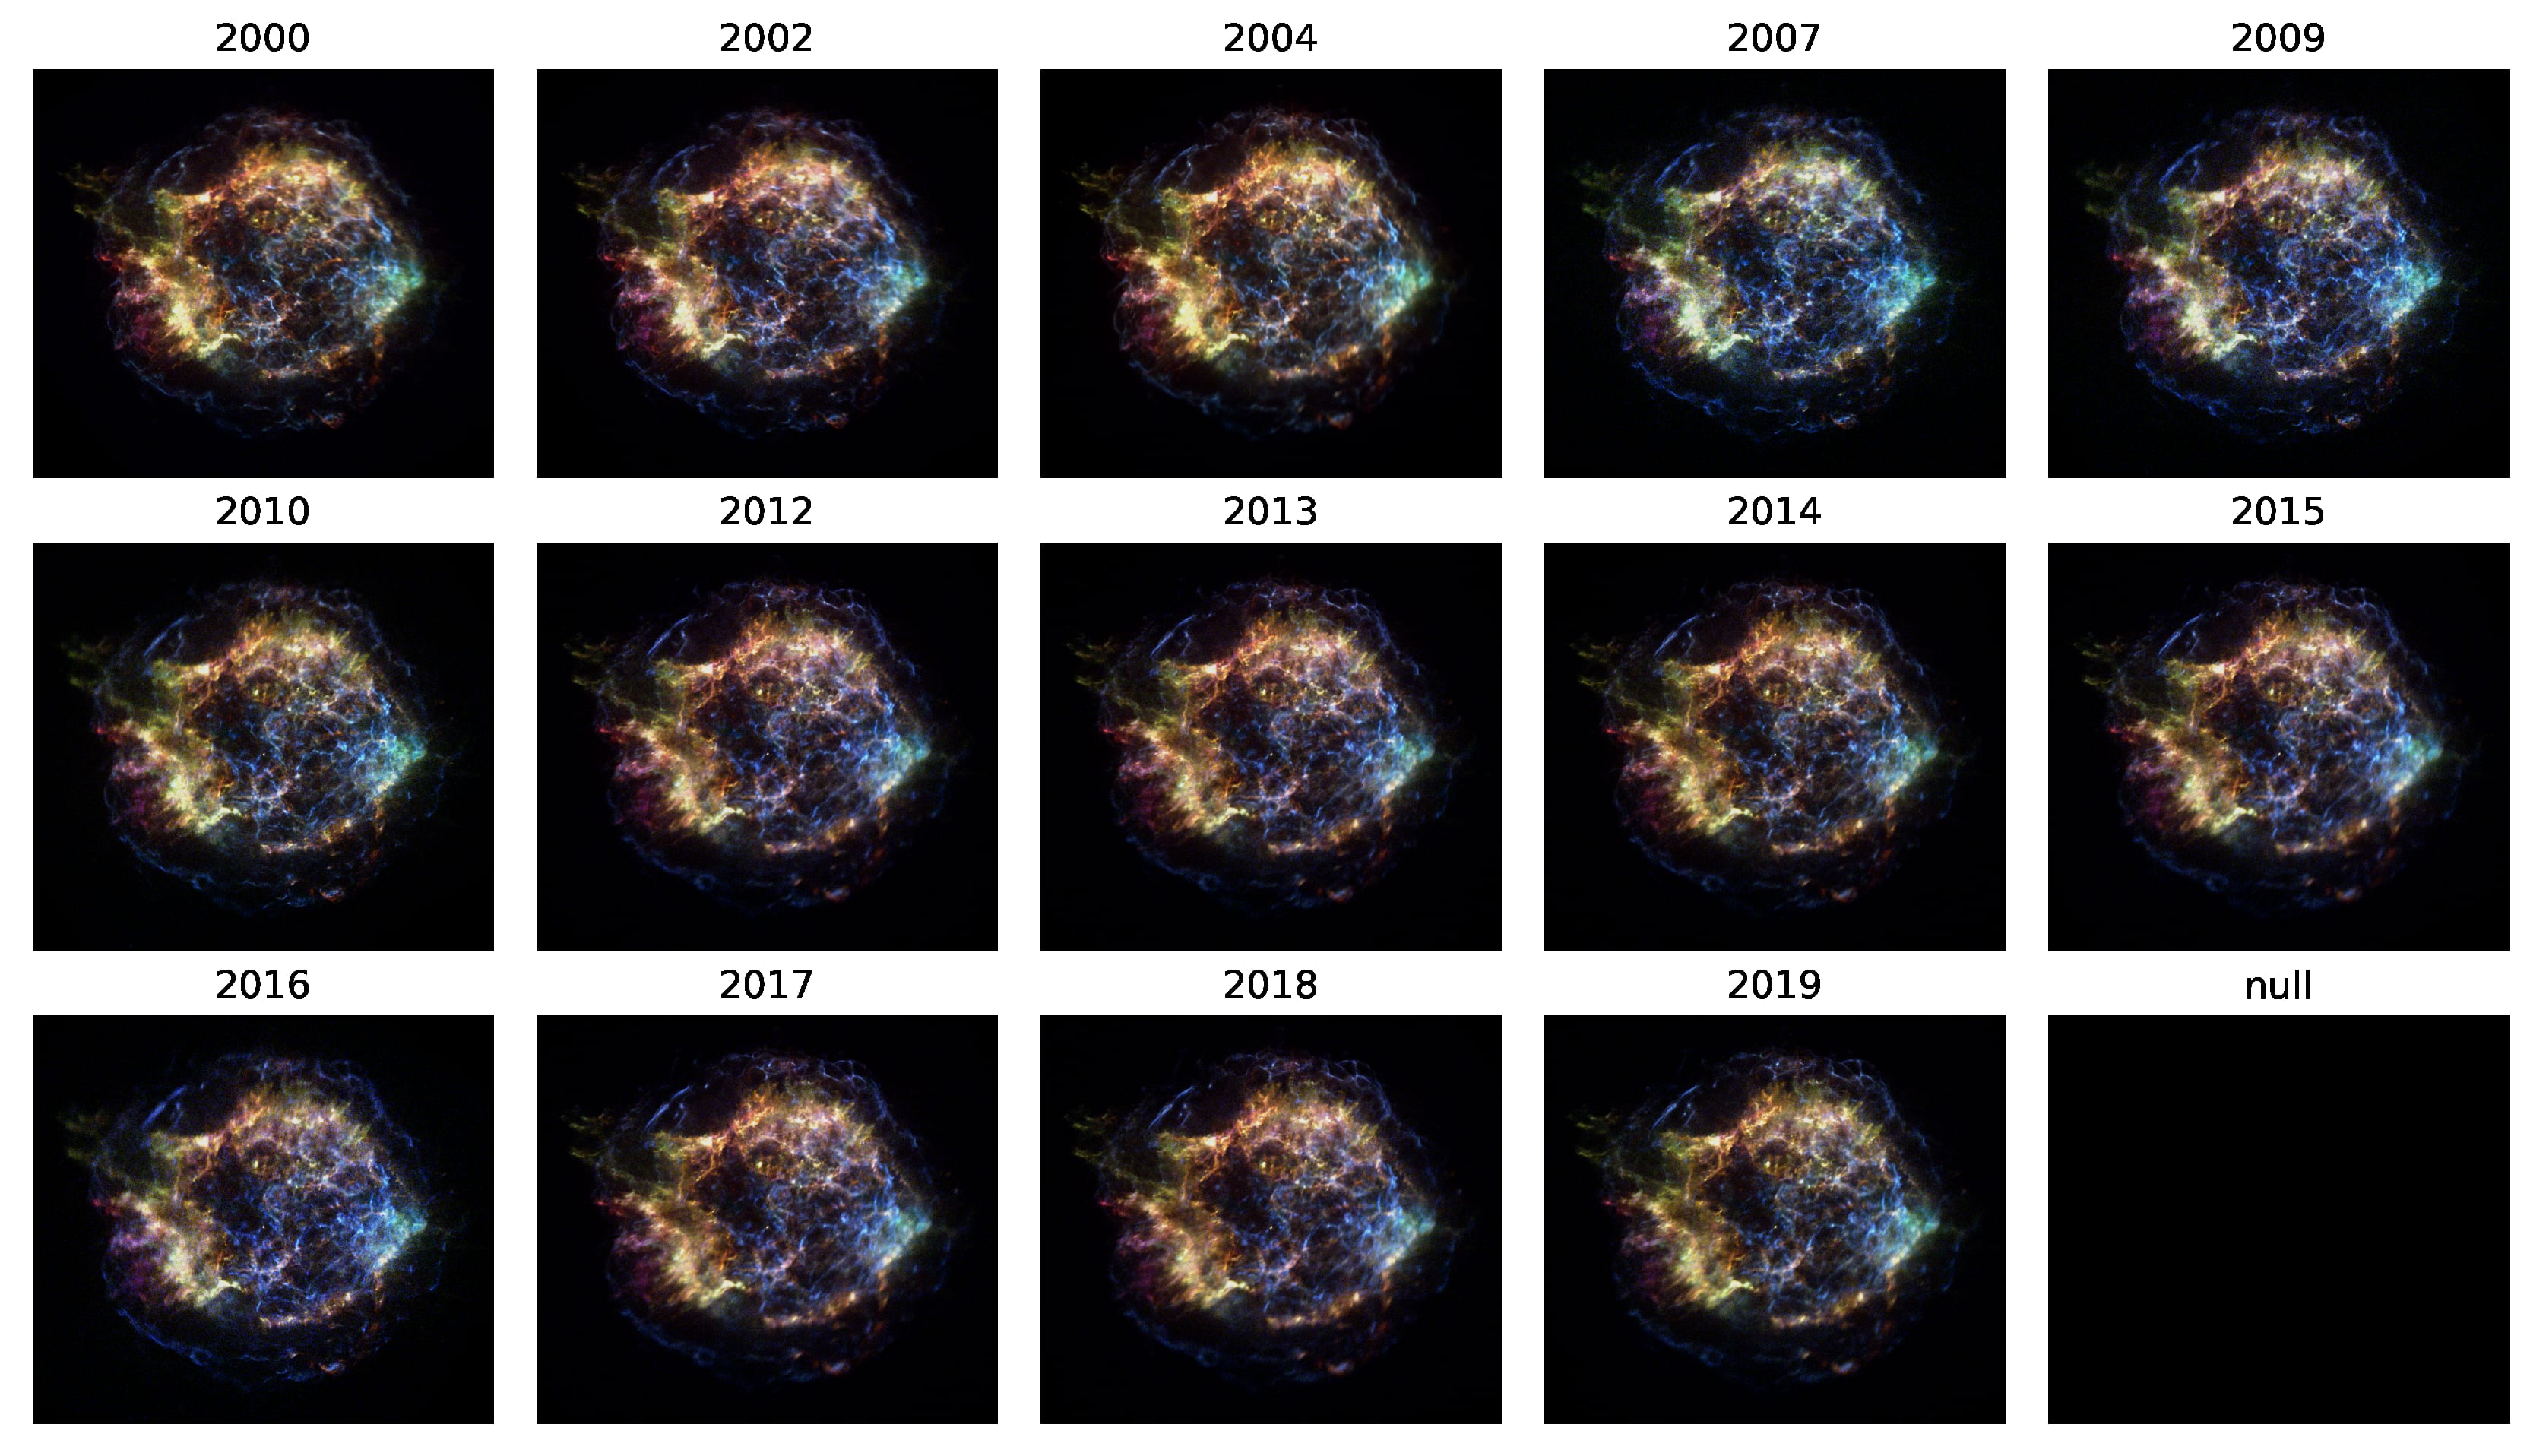
The hazy, inner structures is due to the fact, that data have been combined over a large period of time, and in that large period, the SNR’s structure evolved. It will be more clear if you look at the expansion animation below:
Cassiopeia A SNR in X-ray Spectrum evolving from 2002 to 2019.
The different color intensity for different years is due to the fact that the observation duration is not the same for all the years. If you want to look at individual observations, click 👉 here.
Even though I’ve tried to histogram equalization to balance the colors, but still it doesn’t matches perfectly. However this gives us the idea about the evolution of the SNR.